In this post I will demonstrate how to use VTK to read in a series of DICOM files from a CT examination and extract a mesh surface of the bone structures. I will then show you how to visualize the mesh with VTK and save it, the mesh that is, into an STL file.
Introduction
After the last post on importing DICOM data with pydicom or VTK, you should’ve realized that VTK isn’t just about visualization as the name would suggest. Pain in the a** as it is to learn, VTK offers some fantastic image-processing functionality which you just can’t find in pure python libraries. What’s more is that even if you do find it, chances are it will be rather limited and most certainly computationally slow for real-world applications (still love Python more though, don’t get me wrong).
Case in point, in this post I will show you how to use the VTK Python bindings to extract a mesh-surface from a 3D volume, a process commonly termed as surface extraction, using the marching cubes algorithm implemented in the vtkDiscreteMarchingCubes class. I’ll be using a DICOM dataset of a CT examination which we will load with VTK, exactly as was shown in the last post, threshold it to isolate the bone-structures based on the Hounsfield scale, and then create a single mesh-surface of all the bones. Upon generating that surface, I’ll show you how to visualize that directly into the IPython Notebook, as well as how to save that surface as an STL file for external post-processing and visualization.
If for some reason you don’t have
vtkinstalled in your python distro, then once more I suggest you use the Anaconda distro, of which I wrote in this previous post, and install it viaconda install vtk.
Before I continue, I should note that there is an implementation of marching cubes in the scikit-image package under the measure module. You can find the docs here, while a very nice tutorial on it can be found here.
However, having tested both approaches extensively, I’ve found that the VTK implementation is more robust, way faster, and results in better mesh quality. And in any case, its really easy to adapt the aforementioned tutorial to your needs, and I assume you don’t need a post on that (if you do then feel free to let me know and I’ll be happy to oblige). What you would do is simply load the DICOM data into a NumPy array as I showed last time using pydicom, and then use the skimage.measure.marching_cubes function mentioned above.
Background
The example I will be showing today is a very common procedure in biomedical engineering, and falls under the category of medical image segmentation. In a nutshell, this process allows us to go from the grayish blur that are medical image datasets, to a label-field where each tissue or anatomical structure is characterized by an index, and eventually to a nifty 3D model of the anatomical body that underwent imaging.
As I will be using a computed tomography (CT) dataset, I thought I’d explain a few core-concepts so that you can understand the rationale behind the approach and see that its actually scientifically viable (and not just a meaningless example).
The Hounsfield Scale
The Hounsfiled scale is a quantitative measure of radiodensity. Pixels in an image obtained by CT scanning are displayed in terms of relative radiodensity. The pixel value is displayed according to the mean attenuation of the tissue that it corresponds to on a scale from –1024 to over 3000 on the Hounsfield scale. Water has an attenuation of 0 Hounsfield units (HU) while air is –1000 HU, bone is typically +400 HU or greater and metallic implants are usually +1000 HU.
Therefore, the pixel-data in a CT image give us a direct way to roughly identify the tissue type each pixel belongs to. Thus, simply by means of thresholding the image to known ranges, we can extract given types of tissue straight from the image without hassle! How great is that?! In case you’re not impressed then let me mention that the manual segmentation of medical image data and the creation of label-fields is the most arduous, soul-sucking, repetitive procedure in the field of biomedical engineering!
What we’ll do in the example is use such a CT dataset, threshold it to values over 400 HU, thus isolating all bone-structures, and then use the marching cubes algorithm to create a beautiful 3D mesh of those structures.
Converting raw pixel-data to HU: This is actually very important for real-world examples so pay attention! A typical CT image is not saved directly in HU. In 99% of the cases the ‘raw’ pixel-data needs to be rescaled. Therefore, DICOM images of CT examinations typically contain two values in their metadata, most commonly called
RescaleSlopeandRescaleIntercept. These values are simply theaandbin a typical linear transformation. The formula for calculating the HU out of the raw pixel-data ishu = pixel_value * slope + intercept. While thevtkDICOMImageReaderclass we’ll be using here applies this rescaling internally, that is not the case with all DICOM libraries,pydicomfor example doesn’t do that, so be careful!
The ‘Visible Human’ Dataset
Much as I would’ve liked to use the dataset of my own head as I did in the last post, I needed a CT examination dataset for the purposes of this post and no physician would agree to bombard my head with a ridiculous amount of radiation just so I can play around with it (bunch of pedantic prudes 🙂 ). In fact, the majority of openly available CT datasets are acquired from cadavers.
In case you’re not in the biomed field then you may not have heard of the ‘Visible Human’ project, where the body of an executed convict was frozen, cut in 1mm slices, and extensively photographed and imaged with MR and CT. Well, this jolly story gave us the invaluable dataset we’ll be working with today!
As I mentioned in the previous post, getting the ‘Visible Human’ data requires one to pay a hefty price of a couple Gs, and sign a bunch or license agreements. Obviously, that would be too much for a humble blogger :).
However, I came across this wonderful website which distributes loose sections of that data without any license agreement in sight and no expressed restrictions. In my book, that’s a green light :). I batch-downloaded the DICOM images, and I suggest you do too before they realize what they’ve done, and I’ll be using the head section of the ‘Visible Male’ CT data. You can find a .zip file of those images here.
Surface-Extraction: Marching-Cubes and VTK
Now let’s get to it shall we? As always I’ve put together an IPython Notebook of the entire process which you can find here, while as I mentioned above, you can find the dataset, which you should extract next to the notebook, here.
Function tools
As I love reusing code, you will see in the notebook that I’ve created three convenient functions based on material I presented in previous posts. These are:
vtkImageToNumPy(image, pixelDims): This function allows me to quickly convert avtkImageDataobject to a 3Dnumpy.ndarraywhich I only use to create quick 2D plots of the data with Plotly. This code was presented in this past post on converting arrays between VTK and NumPy.plotHeatmap(array, name="plot"): This function uses Plotly to create a ‘heatmap’ of a 2Dnumpy.ndarraywhich I use to quickly examine the data throughout the process. This code was presented in this past post on converting arrays between VTK and NumPy, while the usage of Plotly in an IPython Notebook was presented in this past post.vtk_show(renderer, width=400, height=300): This function allows me to pass avtkRendererobject and get a IPython Notebook compatible image output of that render with given dimensions. This code was presented in this past post about VTK integration with an IPython Notebook.
As I’ve already presented this code, I won’t bother explaining its inner-workings again but you will see it being used throughout this post and the accompanying notebook.
Reading in the DICOM files
I’m well aware that I showed you how to do this in the last post so I won’t explain the code in detail but I wanted to emphasize the importance of the vtkDICOMImageReader class, and its role in the entire procedure.
PathDicom = "./vhm_head/"
reader = vtk.vtkDICOMImageReader()
reader.SetDirectoryName(PathDicom)
reader.Update()

_extent = reader.GetDataExtent()
ConstPixelDims = [_extent[1]-_extent[0]+1, _extent[3]-_extent[2]+1, _extent[5]-_extent[4]+1]
ConstPixelSpacing = reader.GetPixelSpacing()
Just like in the previous post, we create a new vtkDICOMImageReader under the name of reader which we use to read the DICOM images. Subsequently, we use built-in methods of the vtkDICOMImageReader class to retrieve meta-data values and calculate the dimensions of the 3D array and the pixel spacing, storing it in ConstPixelDims and ConstPixelSpacing. The important thing to remember here is that the reader is the object that holds all that information in its member-variables.
As I mentioned in the ‘Hounsfield Scale’ section, CT data read from DICOM files need to first be rescaled by applying a linear transformation with the formula for calculating the HU out of the raw pixel-data being hu = pixel_value * slope + intercept. However, this appears to be done internally with vtkDICOMImageReader as the pixel values for the different tissues appear to be in the correct range (as you’ll see in the plot later on). However, if linear transformation was needed, let me show you how it would have been done:
shiftScale = vtk.vtkImageShiftScale()
shiftScale.SetScale(reader.GetRescaleSlope())
shiftScale.SetShift(reader.GetRescaleOffset())
shiftScale.SetInputConnection(reader.GetOutputPort())
shiftScale.Update()
Now I repeat: this should not be done in this example as it has already been taken care of. This is just FYI. First we would start by creating a new vtkImageShiftScale object under ‘shiftScale’. We would then use the shiftScale.SetScale method to set the scale to ‘RescaleSlope’ which is retrieved through the reader.GetRescaleSlope() (note we’re using the reader object to acquire that value). Similarly we’d set the shift through shiftScale.SetShift and reader.GetRescaleOffset() and the rest is just setting up the pipeline between the reader and the shiftScale and updating the latter. What’s important here, is that if we did that then the image-data we would be using from this point forward would come from shiftScale and not the reader as we would want to ‘operate’ on the modified data and not the original.
At this point we have the image-data in place and ready to be processed. Using the ‘function tools’, we create a quick conversion of the vtkImageData object residing within the reader to a NumPy array create a plot with Plotly as such:
ArrayDicom = vtkImageToNumPy(reader.GetOutput(), ConstPixelDims)
plotHeatmap(numpy.rot90(ArrayDicom[:, 256, :]))
We create this nifty little plot seen below of a cross-section through the body. Note that we use numpy.rot90 to rotate the image data by 90 deg to make the resulting plot more ‘legible’. You will see that the air surrounding the body has a HU value of -1000, soft tissue like brain-matter has HU values of 20 - 50, while bone-structures range from ca. 400 HU and up. Just the type of values we would expect based on the Hounsfield scale.

As you might remember from the Plotly post, the resulting plot is very much interactive allowing for zoom, pan, and hover-tooltip operations. However, WordPress wouldn’t allow me to embed it in this post, some paranoid security feature I guess, so do check it on the accompanying notebook and explore the HU values of the different tissues.
Thresholding the data
Now let’s get onto the fun part :). What we have now is the HU of the CT image stored within the vtkDICOMImageReader object named reader. As I explained in the ‘Introduction’ what we need to do next is use the fact that bone-structures exhibit HU values of 400 and above. Thus we need to apply thresholding, mask out all non-bone tissue from the image, and create a… bone-mask if you will. Let’s see how we’ll do that:
threshold = vtk.vtkImageThreshold ()
threshold.SetInputConnection(reader.GetOutputPort())
threshold.ThresholdByLower(400)  # remove all soft tissue
threshold.ReplaceInOn()
threshold.SetInValue(0)  # set all values below 400 to 0
threshold.ReplaceOutOn()
threshold.SetOutValue(1)  # set all values above 400 to 1
threshold.Update()
Firstly, we create a vtkImageThreshold object named threshold. We add it to the VTK pipeline by ‘connecting’ its input to the ‘output’ of the reader. In layman’s terms what the threshold.SetInputConnection(reader.GetOutputPort()) command does is pass the pointer of the vtkImageArray residing under reader to threshold. Thusly, we have no overhead and no memory-copying. Hence the term pipeline I’ve been using so liberally :).
Subsequently, we use the ThresholdByLower method of the vtkImageThreshold class, calling it as threshold.ThresholdByLower(400). What we tell threshold here is that all pixels with HU values below 400, i.e., soft-tissue, are in-range. Therefore, all pixels with HU values above 400, i.e., bone-structures, lie in the out-range. We’ll see what this means.
We then call threshold.ReplaceInOn() which tells threshold that we intend to replace all in-range pixel-values in the array with another value. In this case, as we want to clear out all soft tissue, that value will be 0 which we accomplish through threshold.SetInValue(0). Following a similar rationale, we call threshold.ReplaceOutOn() allowing us to replace all out-range pixel-values with another value which we set to 1 through threshold.SetOutValue(1). What we did here is essentially create a boolean-mask where all pixels representing bones were set to True and all other pixels to False. We’ll see why we did that below.
Lastly, we just call threshold.Update(), thus enforcing the thresholding and presto! A quick plot with Plotly as we did before shows us the thresholded array below.

Extracting the surface
So here we are, the most interesting and yet shortest part of the code, i.e., the surface extraction. At this point, we have the ‘boolean-array’ we created above by means of thresholding which can be considered to be a label-field with only two labels: 1 for the bones and 0 for everything else.
As stated prior we’re gonna use an implementation of the marching cubes algorithm implemented in the vtkDiscreteMarchingCubes class. What this class does is “generate object boundaries from labelled volumes” which it achieves by taking “as input a volume (e.g., 3D structured point set) of segmentation labels and generates on output one or more models representing the boundaries between the specified label and the adjacent structures. One or more label values must be specified to generate the models”. Check the docs if you want to learn more as I’m not going to explain how ‘marching-cubes’ works. Just take my word for it when I say its practically the de-facto solution for surface extraction from a volume.
Now don’t be surprised when you see how little code is needed to achieve our goal:
dmc = vtk.vtkDiscreteMarchingCubes()
dmc.SetInputConnection(threshold.GetOutputPort())
dmc.GenerateValues(1, 1, 1)
dmc.Update()
By now you should be familiar with the creation of a new VTK object and its addition to the pipeline. What we do here is create a new vtkDiscreteMarchingCubes object under dmc and add it to the pipeline. What’s important to note is the sequential nature of this pipeline as we connect dmc to the threshold since we need to perform the marching-cubes operation on the thresholded array and not the original.
Before I explain the 3rd line, which is the important one, let me quickly show you the signature of the GenerateValues method which actually ‘belongs’ to the vtkMarchingCubes class, the parent class of vtkDiscreteMarchingCubes. The docs for that can be found here. The signature is the following:
void vtkMarchingCubes::GenerateValues(int numContours, double rangeStart, double rangeEnd)
As you can see, the first parameter is the number of contours or iso-surfaces we want to generate. The next two parameters are the label-index range we want to account for. As you can understand, this class allows us to create multiple surfaces based on a label-field with several indices, resulting in several surfaces.
However, that it not the case for our example. We merely want to create 1 surface, for all the bone pixels which have a value of 1. Therefore, our call to that method is dmc.GenerateValues(1, 1, 1). Finish off with a call to Update and we have our surface, the data for which resides in the form of a vtkPolyData object under dmc.
As you will see in the accompanying notebook, I timed the operations shown above, which took
2-3seconds on my humble Macbook Pro. Take my word for it when I say that this is really, really fast for a marching-cubes operation performed on a single-core.
Visualizing the surface
Next up is the visualization of the surface in VTK as we’re dealing with 3D objects and our typical approaches of employing packages like matplotlib, bokeh, or plotly won’t cut it (neither in terms of functionality nor speed).
I will give the necessary code here for the sake of consistency but my explanation of what it does will be compendious. I presented a very similar code in this earlier post when visualizing a red ball so check there for details. Its pretty much the same code (with a little added flavor):
mapper = vtk.vtkPolyDataMapper()
mapper.SetInputConnection(dmc.GetOutputPort())

actor = vtk.vtkActor()
actor.SetMapper(mapper)

renderer = vtk.vtkRenderer()
renderer.AddActor(actor)
renderer.SetBackground(1.0, 1.0, 1.0)

camera = renderer.MakeCamera()
camera.SetPosition(-500.0, 245.5, 122.0)
camera.SetFocalPoint(301.0, 245.5, 122.0)
camera.SetViewAngle(30.0)
camera.SetRoll(-90.0)
renderer.SetActiveCamera(camera)
vtk_show(renderer, 600, 600)
What we’re doing here in a nutshell is first create a vtkPolyDataMapper to map the surface into graphic-primitives, feeding it the surface data generated and housed in dmc. We then create a vtkActor that will graphically represent that vtkPolyDataMapper and a vtkRenderer to which we add the vtkActor. As I said, all this was explained in detail in this earlier post.
What’s new here is our manipulation of the scene’s camera. Before we pass the vtkRenderer to our helper-function vtk_show described in the Function tools section, we need to modify the camera to give us a good view of the surface. The first important line of code here is camera = renderer.MakeCamera(). What the MakeCamera method does is either create an appropriate vtkCamera object for this scene or, should one already exist, returns a pointer to that camera. We can then use this object to modify the camera’s properties. When we’re done amending properties we just add it back to the vtkRenderer through renderer.SetActiveCamera(camera). Now don’t sweat the properties I’ve set in the code. To be honest with you, the way I acquired all those values was by first saving the generated surface to an .stl file (we’ll see how below), opening it in ParaView, and copying the camera settings yielding a view I liked.
After tossing the renderer to vtk_show as such vtk_show(renderer, 600, 600), we get a nice 600×600 render which you can see below.
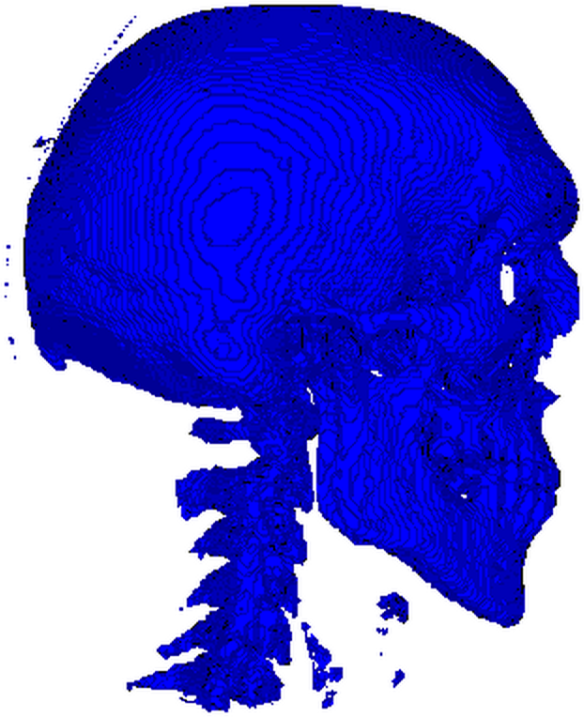
Don’t be alarmed by all those little specks flying around the skull and the vertebral column. It just means we were too lenient with our thresholding and should have set it higher than
400. The stuff in front of the vertebrae are parts of the laryngeal skeleton, while those little tendrils around the skull are most likely segments of the cranial vasculature. Good segmentation, isn’t as easy or straightforward as I (hope I’ve) made it seem.
Exporting the surface as an STL
For you that don’t know what an STL file let me just say that its a standard in CAD, 3D printing, and a myriad other graphics-related applications. Not the most powerful of formats but definitely the most common and widely supported.
In this last part of the code we’ll save the generated surface as an STL file which we can then visualize and post-process in pretty much any 3D graphics and simulation application (although I suggest ParaView for your basic needs). The code is the following:
writer = vtk.vtkSTLWriter()
writer.SetInputConnection(dmc.GetOutputPort())
writer.SetFileTypeToBinary()
writer.SetFileName("bones.stl")
writer.Write()
You should’ve really gotten the hang of it by now right? After creating a vtkSTLWriter under writer, we ‘connect’ it to the dmc which contains our surface. What’s noteworthy is that the STL format supports both ASCII and binary file types but we choose the latter through the SetFileTypeToBinary() method (just to make the file smaller). After setting the filename to bones.stl, thus intending to save under the current working directory, we call the Write() method which does all the work. Note, that unlike most VTK classes which use Update, the saving of the file happens through Write. Be careful :).
So that was it! I hope you enjoyed this gargantuan post as it took forever to prepare, and you won’t be getting another for some time. Remember to check the notebook containing the entire code here and don’t forget the CT dataset here. Do drop me a comment if you run into any trouble with this.

Pingback: Ray Casting with Python and VTK: Intersecting lines/rays with surface meshes | PyScience
Pingback: From Ray Casting to Ray Tracing with Python and VTK | PyScience
Pingback: Image Segmentation with Python and SimpleITK | PyScience
Pingback: Multi-Modal Image Segmentation with Python & SimpleITK | PyScience
Pingback: Volume Rendering with Python and VTK | PyScience
I wanted to find intensity of voxel for intepolation and registration.How can I find intensity of voxel?
LikeLike
The intensity of the voxels is simply the value of the voxel in the array. Read the DICOM in as a NumPy array and you got ’em.
LikeLike
Hi Adamos,
This is great stuff … I have a number of datasets generated from a MicroCT. The data sits in either a single unsigned 16 bit raw file, or as a number of sequential tiff images with each image representing one slice – any idea how to read such into a numpy array as the end result needs to be STL as here!
LikeLike
Hey Simon, thanks for reading :). MicroCT should be fairly easy if you get the thresholds right but I haven’t done cancellous bone in forever so you’re gonna have to rethink the the thresholds.
As for reading the data in both the raw binary and TIFF are easy to read.
In the case of the latter, take a look at my SimpleITK post (https://pyscience.wordpress.com/2014/10/19/image-segmentation-with-python-and-simpleitk/) and give the ImageSeriesReader class a go (http://www.itk.org/SimpleITKDoxygen/html/classitk_1_1simple_1_1ImageSeriesReader.html). I’m pretty sure it supports TIFF and I believe you can just feed it a directory of sequentially named images. You could always try to read it with VTK and the vtkTIFFReader instead (http://www.vtk.org/doc/nightly/html/classvtkTIFFReader.html) but I think that one would have to be per-file. I recommend the SimpleITK path since its super easy to load the whole thing, perhaps perform some segmentation and then convert it to VTK.
Now for the raw binary files its just embarrassingly simple with NumPy and the fromfile method (http://docs.scipy.org/doc/numpy/reference/generated/numpy.fromfile.html) but you’re gonna have to be careful to define the right data-type (number of bytes/number) and dimensions so you can later on reshape the NumPy array from a flat 1D to the proper 3D array.
Lemme know if you run into trouble, I’ve had my fair share with this type of tossing data around 🙂
Cheers,
Adam
PS. Once you get into NumPy I hope you can easily follow the instructions and VTK it right 🙂 ?
LikeLike
Hi Adam,
I’ll have a go! SimpleITK caused my mac to crash when loading python so i’ve had to resort to Windows… then I’ll try VTK (and cry!)
Simon
LikeLike
Holy Python! SimpleITK actually crashed your mac and not just your Python?! Never heard of that one before :D. Have you considered using Wakari.io and installing SimpleITK from one of the SimpleITK .egg files I provided? This way you have Anaconda on Linux and don’t have to worry about biblical crashes:)
Alternatively, you may want to rebuild SimpleITK on your Mac. The Mac egg I provided is the one I’m not confident in due to a bug in CMake and hackery I had to apply to create it. You can find instructions on how to compile it under the same post in the form of a gargantuan comment 😉
Lemme know how you go 🙂
Cheers,
Adam
LikeLike
Hi Adam,
Sorry – I meant python crashed rather than the Mac! It was a long day …. I’m going to try your Mac egg and if all else fails I’ll just have to try to compile. I’ll let you know how I fail (I mean how i get on!).
As for the thresholds, this is actually fossil material anyway – teeth to be precise.
Simon
LikeLike
Hi Adam,
Sorry – back after a slight diversion .. and this is a really basic question!
I just need a few pointer around the correct reshaping of the NumPy array. My raw data is unsigned 16 bit. Dimensions are x = 1999, y = 2000, z = 1637 i.e 1637 individual slices.
I can read it into numpy no problem … eg. ct_raw= np.fromfile(input_raw,dtype.np=uint16)
is the reshape simply ct_raw.shape(1999,2000,1637) i.e I simply reshape it based on the dimensions above?
Simon
LikeLike
Hi Simon,
the reshape you need to do depends entirely on how the file was saved, i.e., C or Fortran order, i.e., row-major or column-major order. Numpy actually exposes the order as a parameter in the `reshape` method. Simply read the file from the binary as a flat thing and then use ‘reshape’.
Honestly, your problems will be in handling a 6 billion-cell array that will require at least 24GBs of RAM :).
LikeLike
Hi Adam
You’re right, the big arrays are fun to handle. What I eventually did was to simply use indexing to pull out the bits I actually need to deal with.
I end up with a 16 bit numpy array which I can convert to VTK using the numpy support in VTK.
I end up with a VTK floating point array which I need to feed into marching cubes. I thought this bit would be easy .. but VTK has defeated me …
Using your code
dmc = vtk.vtkDiscreteMarchingCubes()
dmc.SetInputConnection(threshold.GetOutputPort())
dmc.GenerateValues(1, 1, 1)
dmc.Update()
I thought I could just do the following (assuming vtkdata is my vtkarray)
dmc = vtk.vtkDiscreteMarchingCubes()
dmc.SetInputData(data.VTKObject)
dmc.GenerateValues(1, 1, 1)
dmc.Update()
But this just gives me an AttributeError on setInputData ….
I realise it’s probably something very basic I’m doing wrong – probably my lack of understanding of VTK pipelines!
Simon
LikeLike
Hey Simon, I must be getting something confused but you’re not actually trying DMC on float data are you? DMC is meant to work on a labelfield, e.g., an array with lets say integer values ranging from 0 to 100 for 100 tissues.
If you feed it a float array it’ll most likely explode.
Also, can you paste the ‘AttributeError’ you’re getting?
LikeLike
What you probably want to do is create a vtkImageData object, shove the numpy data into it through:
image.GetPointData().SetScalars(vtk_array)
and then use the
dmc.SetInputConnection(image.GetOutputPort())
mechanism. Keep in mind that ‘SetInputConnection’ and ‘SetInputData’ are very quite different approaches
LikeLike
Hey Adam – I really appreciate this!
OK, so the easiest thing to do is run through this bit by bit and hopefully (if you’re still willing!) you can point out where I’ve gone wrong.
I start off with a raw uint16 CT file
Import into numpy and reshape it.
ctraw = ‘SW_tray1.raw’
ctstack=np.fromfile(ctraw,dtype=’uint16′)
ctstack.shape = (1791,1847,1856)
Now this thing is about 14Gb … so I pull out one of the objects I’m interested in and do a v simple threshold on it.
jrxx = ctstack[229:311,1338:1560,730:910]
mask = jrxx < 5567
jrxx[mask] = 0
I can run marching cubes in skimage and check out the result and it's OK
verts, faces = marching_cubes(jrxx,1,(1.0,1.0,1.0))
mlab.triangular_mesh([vert[0] for vert in verts],
[vert[1] for vert in verts],
[vert[2] for vert in verts], faces)
mlab.show()
Now I want to try in VTK as it's actually got an STL writer which is the final product I need …
So .. convert the numpy array to vtk
vtkarray = numpy_support.numpy_to_vtk(num_array=jrxx.ravel(), deep=True, array_type = vtk.VTK_UNSIGNED_INT)
define a VTK image data object
vol = vtk.vtkImageData()
vol.SetScalarType(vtk.VTK_UNSIGNED_INT)
vol.SetDimensions(jrxx.shape)
vol.GetPointData().SetScalars(vtkarray)
vol.Update()
Try to put through marching cubes …
dmc = vtk.vtkDiscreteMarchingCubes()
#dmc.SetInputConnection(vol.GetOutputPort())
dmc.SetInput(vol)
dmc.GenerateValues(1,1,1)
dmc.Update()
If I do the GetOutputPort then I get this ….
Traceback (most recent call last):
File "”, line 1, in
AttributeError: GetOutputPort
Doing dmc.SetInput(vol)
Doesn’t give any errors
Try to write out the STL
writer = vtk.vtkSTLWriter()
writer.SetInputConnection(dmc.GetOutputPort())
writer.SetFileTypeToBinary()
writer.SetFileName(“test.stl”)
writer.Write()
And I get an empty STL file ….
LikeLike
Sorry, that should say
dmc.SetInputData(vtkdata.VTKObject)
LikeLike
hi ,it useful to me
LikeLike
Hi Adamos! This post is really very helpful, thank you.
I am not working in iPython notebook so I have modified the code in this post to display the images independently of iPython notebook. However what I would really like is to be able to display the 3D rendering of the skull in an interactive window rather than as a static image (so that the skull can be rotated and viewed from different angles).
Unfortunately I am a complete VTK novice and I am struggling to understand how to get this to work. I have found a script (http://www.vtk.org/Wiki/VTK/Examples/Python/vtkWithNumpy) that displays a 3D rendering of cubes from a pixel array in exactly the kind of window I want to use, however I am struggling to modify it to display output from discrete marching cubes. If it’s not too much trouble, do you have any advice on how I could do this?
Many thanks,
Andy
LikeLike
Since posting this I have now got it working! I used the following code to display the output of the dmc algorithm in an interactive window:
mapper = vtk.vtkPolyDataMapper()
mapper.SetInputConnection(dmc.GetOutputPort())
actor = vtk.vtkActor()
actor.SetMapper(mapper)
renderer = vtk.vtkRenderer()
renderer.AddActor(actor)
renderer.SetBackground(1.0, 1.0, 1.0)
renderWindow = vtk.vtkRenderWindow()
renderWindow.AddRenderer(renderer)
renderWindow.SetSize(600, 600)
renderInteractor = vtk.vtkRenderWindowInteractor()
renderInteractor.SetRenderWindow(renderWindow)
renderInteractor.Initialize()
renderInteractor.Start()
LikeLike
Hey Andy,
huh you know I don’t often get requests to simplify a process I’ve documented. The typical questions are akin to “I’ve made the code read that file you rambled on for 30 pages, now how can I program my lawnmower brew me coffee?”. Its rather refreshing. Anyway, all you need to do is instead of using the `vtk_show` function, you plug the renderer as is in a vtkWindow as such:
“`
renderer_window = vtk.vtkRenderWindow()
renderer_window.AddRenderer(renderer)
renderer_interactor = vtk.vtkRenderWindowInteractor()
renderer_interactor.SetRenderWindow(renderer_window)
renderer.SetBackground(1,1,1)
renderer_window.SetSize(1024, 768)
renderer_interactor.Initialize()
renderer_window.Render()
renderer_interactor.Start()
“`
This should generally fly well and as you can see its pretty much what the example you mentioned does 🙂
LikeLike
Oh derp just saw that you sorted it out yourself :P. Kudos 🙂
LikeLike
Hi, Thanks for the useful post. I would like to ask you a couple of things:
form the marchingcubes I am getting small portions of data that are not connected to the big mesh (like the small parts you have), my question is if you know how to get rid of them from the vtk polydata. Thanks!
LikeLike
Hey Roger, truth be told if you wanted a clean model you wouldn’t create it straight out of the thresholding operation but rather you would follow up the thresholding with other basic segmentation techniques. In this case you want to (1) remove island, i.e., little flying/disconnected specks and optionally (2) fill holes, i.e., well holes.
While VTK has some classes for that sort of thing I would definitely suggest you use SimpleITK (see my post, https://pyscience.wordpress.com/2014/10/19/image-segmentation-with-python-and-simpleitk/) and in particular the VotingBinaryIterativeHoleFillingImageFilter class (http://www.itk.org/SimpleITKDoxygen/html/classitk_1_1simple_1_1VotingBinaryIterativeHoleFillingImageFilter.html) which you can use to do both 🙂
LikeLike
Hey man !
Just a big thank you for all your posts about VTK ! You made the VTK hell into a VTK heaven, and that is an achievement for sure 😉
LikeLike
Haha dunno about ‘heaven’, something closer to limbo or purgatory perhaps :). Thanks though 😀
LikeLike
I’d like to know if there is a possibility of extraction of entirely closed (but hollow inside) structure. Assuming a reconstruction of a vessel (to simplify: a straight cylinder) based on CT scans, I need to obtain STL comprising a wall and 2 parallel surfaces such as inlet and outlet to that vessel. Is it possible with VTK and python? It would be even more helpful, if somehow STL could be filled inside (but that is secondary question). P.S. Inlet, outlet and wall can be saved as separate STL files.
I’ve based on yours tips and I’m really grateful for your job! I’ve successfully generated wall of the vessel without any problems, however, I need inlet and outlet to that vessel as well. Any tips for that and for filled object?
LikeLike
Hm while I know it’s possible, cause VMTK does it through VTK and ITK, I also think it’s not a easy or fully automatic task. You may wanna have a look at VMTK first
LikeLike
Hello Adamos,
Thank you for a fast response. I’ve read about VMTK, however, I’d like to omit using it due to problems with future installation – Windows binary file doesn’t work for me (even after typing in environmental variables), whereas compiling in CMake is awful and impossible-to-handle for many people, including me 😀
I’ve created a software using Python with wxPython wrapper that is capable of loading all DICOM, RAW files, etc. that bases on specific VTK distribution (so when VMTK installs, it can install again VTK and probably that’s why it’s not working: having 2 VTKs to operate with). During many user-defined processes, a 3D mask is updated (e.g. of aortic arch) and then is subjected to the DiscreteMarchingCubes algorithm you have presented so as to create STL file. As a result, I obtain a wall of the vessel.
I’d like to use this model in the CFD analysis, therefore, I need surfaces of the inlet and outlets. I know VMTK is capable of doing so, however, as stated before, I failed at installing it. Moreover, my software has to be as simple as possible (now it’s a pure executable, where user can just install it and everything works fine) – without the need of compiling in CMake and adding stuff in environmental variables.
It’s a pity I cannot combine my program with VMTK, since VMTK can even create Fluent Mesh… Do you know any freeware software capable of filling STL files or performing volume meshing on the surface STL?
Kind regards,
Zibi
LikeLike
Hey Zibi,
i’ll try and adress the stuff you mentioned
1) Last I checked, and its been a while, VMTK depends on a ‘custom’ version of VTK it bundles/compiles itself hence the two VTKs
2) I can’t give you any decent way of defining the inlet/outlet. The only thing that comes to mind is to somehow find and cut the ends of the vessel, possibly by detecting the smallest surfaces where the element angles don’t change dramatically (thus giving you groups of triangular elements that should belong on a smooth-ish surface on the vessel, which are bound to be the inlets/outlets)
3) I know VTK doesn’t, or at least didn’t, do volume meshing. For that you need to look at TetGen, NetGen, CGAL etc. You may wanna give meshpy (https://mathema.tician.de/software/meshpy/) a go as it wrap TetGen. Also, I’ve recently heard something about PyMesh (https://github.com/qnzhou/PyMesh) that may be of help
Sorry I couldn’t be of more help
LikeLike
Hi Adam,
thanks a lot for your helpful tutorial and the IPython notebooks!
As a short comment to your example application I wanted to suggest to use Marching Cubes on the original image instead of Thresholding plus Discrete Marching Cubes, which creates a smoother and more accurate surface mesh. Something like:
%%time
# dmc = vtk.vtkDiscreteMarchingCubes()
dmc = vtk.vtkMarchingCubes()
# dmc.SetInputConnection(threshold.GetOutputPort())
dmc.SetInputConnection(reader.GetOutputPort())
# dmc.GenerateValues(1, 1, 1)
dmc.SetValue(0,400)
dmc.Update()
Thanks again!
Best,
Marvin
LikeLike
Hey Marvin, thanks for the feedback! Yeah it makes sense though I wonder if complex detailed anatomies would come out looking ‘right’ in an anatomical sense
LikeLike
Hi Adam,
in fact you can even resolve better like this, since you don’t discretise (threshold) and smooth again (discrete marching cubes), but use an iso contour at the interpolated threshold level.
I uploaded the result (https://postimg.org/image/72l7xv2wl/) and you can see the skull’s teeth!
Best,
Marvin
LikeLike
hey wow that does look great. I guess you could do a good segmentation/labelling on a more complex model and then do a single DMC run on the discrete labels. Been a while since I attempted it. Thanks for the tip though, I’m sure it’ll come in handy 🙂
LikeLike
Thanks. That really helped me out!
LikeLike
Hi Adam
Thanks for article . As you mentioned in this post you have fetched labels by passing DICOM images .then at end entire volume is saved to stl file.
My question is if I have .stl file , is there any way to fetch labels from it,? or I need to pass all DICOM images and based on HU field I should show label file for each subject
Please guide
Thanks
LikeLike
Hi Sagar, well STL files are tricky beasts. If you had multiple separate objects exported in an STL format then its typically easy to separate those objects. However, in segmentation the different labeled tissues form very tight surfaces so once you export, lets say, a segmented anatomy then you can’t separate those volumes. Furthermore, and I might be wrong here, STL files don’t support any ‘labelling’ as in I’m not aware of one being able to assign a unique integer (label) to disparate volumes as an STL file considers the whole thing to be one volume.
So in a nutshell (unless I’m sorely mistaken) no you can’t get labels from an STL file. You would have to re-segment it with a process similar to the one presented here and get the labels this way. Generally you shouldn’t be using STL to store labelfields but instead stick to formats like Nifti (.nii) or MHD/MHA which support that type of data.
LikeLike
Hi!
Thanks for your very nice post!
Very useful as usual!
Do you know if is there a command to save the result in .stl format? There is a similar tool in itk-snap, but it is interface based, and it is not possible to call it from command line.
Thanks!
S
LikeLike
Hey Sebastiano, not sure what you mean mate given that I’ve actually included a code snippet to do exactly that in the post, specifically:
writer = vtk.vtkSTLWriter()

writer.SetInputConnection(dmc.GetOutputPort())

writer.SetFileTypeToBinary()

writer.SetFileName("bones.stl")

writer.Write()
Are you looking for something different?
LikeLike
Hi!
Thanks for your prompt reply!
Ops, sorry. Forgot to mention that I was starting from a nifti, and not from a dicom…
What I meant was something similar to the following:
import os
import argparse
import vtk
import nibabel as nib
def from_nifti_to_stl(pfi_input, pfi_output):
img = nib.load(pfi_input)
img_data = img.get_data()
img_data_shape = img_data.shape
dataImporter = vtk.vtkImageImport()
dataImporter.SetDataScalarTypeToShort()
data_string = img_data.tostring()
dataImporter.SetNumberOfScalarComponents(1)
dataImporter.CopyImportVoidPointer(data_string, len(data_string))
dataImporter.SetDataExtent(0, img_data_shape[0] – 1, 0, img_data_shape[1] – 1, 0, img_data_shape[2] – 1)
dataImporter.SetWholeExtent(0, img_data_shape[0] – 1, 0, img_data_shape[1] – 1, 0, img_data_shape[2] – 1)
dataImporter.Update()
dmc = vtk.vtkDiscreteMarchingCubes()
dmc.SetInputConnection(dataImporter.GetOutputPort())
dmc.GenerateValues(1, 1, 1)
dmc.Update()
writer = vtk.vtkSTLWriter()
writer.SetInputConnection(dmc.GetOutputPort())
writer.SetFileTypeToBinary()
writer.SetFileName(pfi_output)
writer.Write()
if __name__ == ‘__main__’:
parser = argparse.ArgumentParser(description=’From path to nifti to corresponding stl.’)
parser.add_argument(‘-in’, dest=’pfi_input’, nargs=1, type=str, help=’input path to nifti’)
parser.add_argument(‘-out’, dest=’pfi_output’, nargs=1, type=str, help=’output path where the stl will be saved’)
args = parser.parse_args()
if not os.path.exists(args.pfi_input[0]):
raise IOError(‘Input file not found.’)
from_nifti_to_stl(args.pfi_input[0], args.pfi_output[0])
So that from a terminal writing:
>> python parser.py -in ‘vol.nii.gz’ -out ‘out.stl’
Will convert the vol.nii.gz in .stl format.
At the moment the function from_nifti_to_stl is NOT working.
The output file is empty (it actually contains the string “Visualization Toolkit generated SLA File”).
Considering that I know half of the command I am using there, and therefore this may not be the best strategy, now the next questions: why from_nifti_to_stl is not working and more importantly how do I include the information contained in the affine transformation of the nifti image in the final stl?
Thanks!
Sebastiano
LikeLike
Hm a quick skim over your code reveals no glaring errors. Can you try to visualise the results of the marching-cube operation prior to writing to STL? There’s always a chance the operation failed and thus you had nothing to write to STL.
Also, what do you mean by “how do I include the information contained in the affine transformation of the nifti image in the final stl?”? What information? The STL will only store the current geometry so if you performed some transformation then the STL would simply store the transformed geometry. AFAIK STL can’t store any transformation matrices to be applied later on a geometry.
LikeLike
When i install SimpleITK follow the link https://itk.org/Wiki/SimpleITK/GettingStarted/Visual_guide_to_building_on_Linux . the error is below;
Installation complete
[ 71%] Completed ‘Swig’
[ 71%] Built target Swig
error: RPC failed; result=56, HTTP code = 200
fatal: The remote end hung up unexpectedly
fatal: early EOF
fatal: index-pack failed
Cloning into ‘ITK’…
error: RPC failed; result=56, HTTP code = 200
fatal: The remote end hung up unexpectedly
fatal: early EOF
fatal: index-pack failed
Cloning into ‘ITK’…
error: RPC failed; result=56, HTTP code = 200
fatal: The remote end hung up unexpectedly
fatal: early EOF
fatal: index-pack failed
— Had to git clone more than once:
3 times.
CMake Error at ITK-prefix/tmp/ITK-gitclone.cmake:40 (message):
Failed to clone repository: ‘https://itk.org/ITK.git’
make[2]: *** [ITK-prefix/src/ITK-stamp/ITK-download] Error 1
make[1]: *** [CMakeFiles/ITK.dir/all] Error 2
make: *** [all] Error 2
thank you for your reply
LikeLike
This isn’t really the right blog to ask that question. It’d seem that your cloning the Git repo is failing but I have no idea why that is
LikeLike
Hey Adam,
I just want to say thank you so much for all this information. I’m currently taking Medical Images at college and they want me to manipulate medical images without using MatLab and finding your blog is amazing. Thank you so much for taking your time to share your knowledge on this.
Greeting from El Salvador.
Francisco
LikeLike
Hey Francisco, thanks for the kind words, really glad you’re finding it useful 🙂
LikeLike
Hi,
I am trying to do the same surface extraction for bones with my dataset. I am using python 2.7 and I am getting this error.
raise exceptions.PlotlyDictKeyError(self, path)
PlotlyDictKeyError: ‘scl’ is not allowed in ‘heatmap’
Path To Error: [‘scl’]
How to solve this problem ? and my code is not showing any output for your data.
LikeLike
It’d seem that Plotly have updated their libraries (which makes sense as my code is several years old). If you don’t need that bit I’d comment it. Otherwise you’ll need to revise that code to work with the latest plotly libraries.
LikeLike
Hello,
I met a similar issue when I try this part…
When I try to run the ‘plotHeatmap(numpy.rot90(ArrayDicom[:, 256, :]))’ to get the heatmap of the image data(for showing the HU values), I got an error:
ValueError: Invalid property specified for object of type plotly.graph_objs.Heatmap: ‘scl’
The version of my Python:3.5, the version of my plotly:4.14.3
How can I fix it? Could you please update this piece of code?
Because when I load my own DICOM, I think I need to know the HU values of each tissue first using this function tool…
Thank you in advance!
LikeLike
ArrayDicom = vtkImageToNumPy(reader.GetOutput(), ConstPixelDims)
plotHeatmap(numpy.rot90(ArrayDicom[:, 256, :]))
returns “index 256 is out of bounds for axis 1 with size 1”
what to do???
LikeLike
I’m guessing you’re plotting your own data which doesn’t extend to 256. Check the dimensions of your data and use the middle layer index
LikeLike
thanks a lot, could correct it
LikeLike
I am sorry. I didn’t understand. How did you do this? I am using your data(vhm/head)
LikeLike
The OP wasn’t using my data though so the dimensions were different and there was no 256-indexed slice. If you’re using the original data it should work
LikeLike
hi. can you suggest some multilevel thresholding command for vessels?
LikeLike
moreover how you found values for scene’s camera?
LikeLike
trail-n-error really. alternatively you could just render the scene on an active VTK window and actually manipulate the scene in 3D.
LikeLike
do you mean the actual thresholds? I don’t have the foggiest, depends entirely on your image data.
LikeLike
How to pass input [normal numpy array dicom slides] to STLWRITE?
LikeLike
Hi I’m Ali
How can I convert 2D MRI images to 3D model?
LikeLike
I assume you mean a series of 2D images in which case you just follow the process described in the posts? I’m not very clear as to what you’re talking about 🙂
LikeLike
After quite a few years I i agine the OP has either found a solution or moved on. Maybe both.
For anyone else who stumbles here, you can do one of several things.
The collection of multiple 2d files (a stack) making up a 3d inage goes by a few names, but I think VTK calls it something like a DICOM series or maybe directory. Neither is technically accurate in terms of the dicom standard, bit who’s checking.
VTK has a dicom series reader – you feed it a directory containing dicom files and it does all the sorting and aligning and works out spatial dimensions automatically.
I used the VTK dicom series reader and found it a bit buggy – perhaps because dicom is such a loosely adhered-to standard.
https://kitware.github.io/vtk-examples/site/Cxx/IO/ReadDICOMSeries/
This is in C, but the VTK steps will be fairly similar in python.
ITK is good- a clear example here:
https://examples.itk.org/src/io/gdcm/readdicomseriesandwrite3dimage/documentation
I was annoyed enough to write my own using pydicom- this is painful and requires a good knowledge of DICOM. I advise not going for this option.
These days I prefer to use Medio (pip install it) which acts as a wrapper to pydicom, nibabel and ITK so you have all 3 easily accessible. It will also output to dicom (single and multiple) files, as well as Nifti.
But I don’t use VTK much. Perhaps load, save as a .nii and use the nifti loader in VTK? 🙂
LikeLike
Hi! My dicom data set Height and Width 2000 X 2000 , its not running from this code ? how to solve this error with Original DICOM size?
LikeLike
Pingback: ValueError: Invalid property specified for object of type plotly.graph_objs.Heatmap: ‘scl’ – Ask python questions
This code is quite old and highly unlikely to be compatible with Plotly’s latest APIs. You may wanna check their own tutorials
LikeLike
Hi!
When I run this codes, it raise error”ValueError: Invalid property specified for object of type plotly.graph_objs.Heatmap: ‘scl'”, ‘scl’ is in the module of ‘def plotHeatmap’
How can I solve this problem?
LikeLike
Hey Eileen! This code is so old it’s unlikely to work with Plotly’s API.
LikeLike