
Interactive Plotting in IPython Notebook (Part 1/2): Bokeh
Summary
In this post I will talk about interactive plotting packages that support the IPython Notebook and allow you to zoom, pan, resize, or even hover and get values off your plots directly from an IPython Notebook. This post will focus on Bokeh while the next post will be about Plotly. I will also provide some very rudimentary examples that should allow to get started straight away.
Interactive Plots: +1 for convenience
Anyone who’s delved into ‘exploratory’ data analysis requiring a depiction of their results would have inevitably come to the point where they would need to fiddle with plotting settings just to make the result legible (much more work required to make it attractive). One would have to change axes limits, margins, line-widths, etc etc.
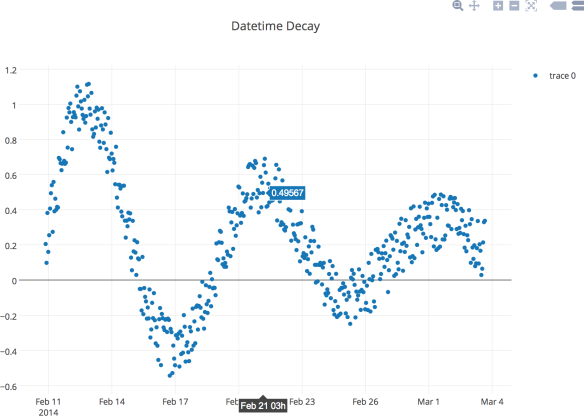
Well, with interactive plotting the days of the static plot are dwindling. Packages such as Bokeh and Plotly (see below) save you a lot of that trouble by providing an easily embeddable plot directly into your beloved IPython Notebook along with a series of ‘tools’ allowing you to zoom and pan the plot, resize the whole thing, save as a static image, or even hover over the plotted data and get lil’ tooltips with their underlying data. A static version of such a plot, which I shamelessly screen-captured from the Plotly website can be seen in the figure below.
Bokeh
Bokeh is a package by Continuum Analytics, authors of the Anaconda distribution of which I spoke in this previous post. If I may quote:
Bokeh is a Python interactive visualization library that targets modern web browsers for presentation. Its goal is to provide elegant, concise construction of novel graphics in the style of D3.js, but also deliver this capability with high-performance interactivity over very large or streaming datasets. Bokeh can help anyone who would like to quickly and easily create interactive plots, dashboards, and data applications.
While Bokeh doesn’t have as many bells and whistles as Plotly (see next post), its entirely free and unrestricted and works like a charm within the IPython console and the IPython Notebook.
Installation
As with most things, a good place to start is the ‘Quick-start’ page.
Assuming you’re running an Anaconda distro, the best way to install bokeh is simply by opening a terminal and entering:
conda install bokeh
Note that if you have multiple separate Python environments, e.g., a Python 2.7 and a Python 3.4 environment as was shown in this previous post, you will need to activate the environment you would like to use Bokeh in and use the above command in order to ‘link’ that package (upon installation into the root environment).
Usage
I’m not going to go into detail here over the inner-workings of Bokeh but rather give quick instructions on how to ‘enable’ it into your IPython Notebook and create a simple plot show-casing some of the interactivity offered by the package.
Merely start your IPython Notebook by entering ipython notebook in your terminal (after having activated the environment in which Bokeh is installed). That should launch a browser with IPython Notebook where you should just create a new notebook.
All you need to do to import and enable Bokeh for plotting within your notebook is to enter the following code within one of the cells:
import bokeh.plotting
bokeh.plotting.output_notebook()
The first command obviously imports the bokeh.plotting module while the second sets the output of any subsequent plotting to be directly ‘fed’ to your IPython Notebook as the output of a typical cell. The ‘Session Management’ section of the Bokeh Reference Guide has more info on the available output options. Should the above code go through without a hitch the output of the cell should read Configuring embedded BokehJS mode.
Having Bokeh in place we’re ready to do some plotting. Here we will calculate the values, coordinates if you will, of a simple sine wave using NumPy. Enter the code below in a subsequent cell:
import numpy
x = numpy.arange(0.0, 100.0, 0.1)
y = numpy.sin(x)
Lastly, we’ll use the very simple line() function of the bokeh.plotting module to create the plot and the show() function to… well show it:
bokeh.plotting.line(x,y, line_width=3.0)
bokeh.plotting.show()
Upon execution, the output of this last cell should be something like what is shown in the figure below. As you can see Bokeh automatically provides tools to pan and zoom the view and even save and resize the plot itself. The plot axes automatically scale and pan themselves to reflect changes imposed by these tools.

You can find an IPython Notebook with the code used to create the above plot here. Note that the nbviewer won’t show the plot as it can only display content embedded into the .ipynb file. If you want to reproduce it, download the .ipynb file and open within your own IPython Notebook session.
Resources
Keep in mind that you can customize Bokeh plots till the cows come home. Apart from being able to change the typical display parameters like line-widths etc, you can define which interactive tools appear, as well as add hover-tooltip functionality.
If you want more info on Bokeh, a good place to start is the Bokeh Tutorial and the User Guide, while the Reference Guide will provide info on many features and more esoteric aspects of the package.

Pingback: Interactive Plotting in IPython Notebook (Part 2/2): Plotly | PyScience
Pingback: IPython Notebook & VTK | PyScience
FYI Bokeh has seen a number of fantastic improvements since the version showed here: New tools like lasso, point, and polygon selection, a much more attractive toolbar, IPython interactor integration, a great linked data table, touch UI support for mobile devices and new higher level interfaces, just to name a few. Expect to see improved GIS and 3D support in 2015. If there’s any additional info we can provide, please let us know at @BokehPlots.
LikeLike
Thanks for the update Bryan! Bokeh is indeed evolving at an incredible rate :). Hopefully i’ll find the time to write a new more comprehensive post on it
LikeLike
Under python 2.7 and bokeh 0.9 I get the error AttributeError: ‘module’ object has no attribute ‘line’ am I using the wring versions?
LikeLike
Hey Robin, I wouldn’t be surprised if recent Bokeh updates broke backwards compatibility. Its been a while since I wrote that post. In fact I think I was using v0.6.1 when I wrote it.
Those methods may have been moved under the ‘plotting’ subpackage: http://bokeh.pydata.org/en/latest/docs/reference/plotting.html
LikeLike